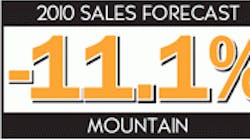
Ewweb 393 2010 Mtn Sales Forecast 0

2010 Mountain Regional Forecast

Nov. 1, 2009
While Salt Lake City sometimes gets overlooked because of the other largest metropolitan areas in the region Phoenix, Denver/Colorado Springs and Las

Mountain Regional Forecast

Arizona • Colorado • Idaho • Montana • Nevada • New Mexico • Utah • Wyoming

While Salt Lake City sometimes gets overlooked because of the other largest metropolitan areas in the region — Phoenix, Denver/Colorado Springs and Las Vegas — it may come out of the recession earlier than these markets. Its unemployment rate is under six percent. And while Denver, Phoenix and Las Vegas have seen building permits drop more than 50 percent year-to-year through August, Salt Lake City's total building permits are down “just” 23 percent. The largest construction projects in the region include the Las Vegas VA Medical Center; Intel's semiconductor plants in Arizona and New Mexico; and two factories being built by global wind giant Vestas in Brighton, Colo. It may take several years for the housing markets to wake up in Phoenix and Las Vegas.

EMPLOYMENT STATISTICSActual Electriciansin thousandsM G C Mountain 53,880 565.7 1,562.9 5,666.9 Arizona 14,520 160.2 386.9 1,504.7 Flagstaff, AZ 210 3.6 NA 45.1 Lake Havasu City-Kingman, AZ 280 3.3 NA 28.5 Phoenix-Mesa-Scottsdale, AZ 10,500 120.3 209.3 1,109.8 Prescott, AZ 280 2.7 NA 36.1 Tucson, AZ 2,120 26.2 74.6 217.5 Yuma, AZ 300 1.7 NA 34.0 Colorado 14,180 130.1 370.8 1,421.1 Boulder, CO 440 16.7 28.0 101.7 Colorado Springs, CO 1,650 13.8 45.7 164.1 Denver-Aurora-Broomfield, CO 8,140 65.0 169.4 783.8 Fort Collins-Loveland, CO 700 10.9 26.1 81.4 Grand Junction, CO 480 2.9 9.3 37.3 Greeley, CO 420 10.9 13.3 38.0 Pueblo, CO 360 4.0 11.4 34.4 - Idaho 3,600 56.7 113.3 361.8 Boise City-Nampa, ID 1,080 23.8 42.4 150.0 Coeur d'Alene, ID 350 4.5 8.7 34.4 Idaho Falls, ID 510 3.5 6.6 31.5 Lewiston, ID-WA 260 3.1 6.1 15.6 Pocatello, ID 170 3.6 19.4 - Montana 2,120 19.4 85.1 272.3 Billings, MT 230 NA 8.2 33.2 Great Falls, MT 120 NA 4.7 14.9 Missoula, MT 220 NA 7.3 23.0 Nevada 8,420 45.0 149.6 791.5 Carson City, NV 120 2.7 11.5 8.1 Las Vegas-Paradise, NV 6,630 23.7 92.5 600.7 Reno-Sparks, NV 1,190 13.0 27.1 121.7 - New Mexico 3,790 31.5 191.7 477.8 Albuquerque, NM 1,750 19.0 80.1 233.9 Las Cruces, NM 260 2.9 18.9 36.5 Santa Fe, NM NA 0.8 16.9 40.4 - Utah 7,250 113.0 198.8 693.8 Logan, UT-ID 240 9.9 10.2 23.8 Ogden-Clearfield, UT 1,210 20.1 44.2 102.5 Provo-Orem, UT 1,130 17.6 22.8 114.2 St. George, UT 550 2.8 6.7 30.7 Salt Lake City, UT 3,520 53.4 93.2 368.5 - Wyoming NA 9.8 66.7 143.9 Casper, WY NA 1.7 5.6 22.6 Cheyenne, WY 350 1.6 13.7 22.7