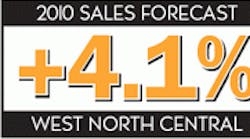
Ewweb 321 2010 Mnc Sales Forecast 0

2010 West North Central Regional Forecast

Nov. 1, 2009
Surprisingly, this region will lead the United States out of recession, according to Moody's/economy.com. Unemployment is quite low in many of the region's

West North Central Regional Forecast

Iowa • Kansas • Minnesota • Missouri • Nebraska • North Dakota • South Dakota

Surprisingly, this region will lead the United States out of recession, according to Moody's/economy.com. Unemployment is quite low in many of the region's MSAs and Nebraska, North Dakota and South Dakota and large parts of Iowa enjoy unemployment rates of near or below the full employment rate of 5.2 percent. While biofuels have always been big business in Iowa and other parts of this region, economists are turning their attention to the rapid growth of wind farms in the Dakotas and Iowa, which are geographically blessed with steady winds and cooperative state governments, power utilities and licensing commissions to get the turbines spinning. Stadium construction in downtown Omaha, Neb., and St. Paul, Minn., and the new performing arts center in Kansas City, Mo., are attracting additional retail and commercial development to these cities.

EMPLOYMENT STATISTICSActual Electriciansin thousandsM G C West North Central 44,570 1,081.1 1,582.9 5,883.5 Iowa 6,630 198.2 232.5 831.1 Cedar Rapids, IA 820 21.6 14.8 77.7 Des Moines-West Des Moines, IA 1,340 18.5 39.6 217.1 Iowa City, IA 280 NA 30.4 23.4 Sioux City, IA-NE-SD 300 12.1 8.8 24.5 Waterloo-Cedar Falls, IA 350 15.2 12.2 43.2 Kansas 5,920 167.7 238.9 737.5 Kansas City, KS 4,620 33.6 55.5 282.4 Lawrence, KS 200 NA 11.8 21.2 Topeka, KS 410 6.7 27.4 61.6 Wichita, KS 1,520 59.3 36.7 163.8 Minnesota 11,150 300.3 396.1 1,647.1 Duluth, MN-WI 770 7.5 24.7 80.1 Minneapolis-St. Paul-Bloomington, MN-WI 6,560 181.7 231.1 1,110.3 Rochester, MN 520 11.1 10.3 75.9 St. Cloud, MN 490 15.5 13.3 57.4 Missouri 12,130 261.2 410.0 1,673.5 Columbia, MO 340 NA 28.2 10.4 Jefferson City, MO 350 NA 27.9 9.1 Joplin, MO 300 13.5 8.4 22.1 Kansas City, MO NA 42.9 90.4 349.8 Kansas City, MO-KS Metropolitan Statistical Area 4,620 76.5 145.9 632.2 St. Louis, MO-IL 6,590 117.1 153.0 852.4 Springfield, MO 1,150 14.7 25.2 125.4 Nebraska 5,010 91.7 163.1 547.9 Lincoln, NE 790 13.3 37.4 97.6 Omaha-Council Bluffs, NE-IA 3,160 32.3 63.3 295.1 North Dakota 1,920 23.9 68.4 204.8 Bismarck, ND 280 2.3 11.8 38.5 Fargo, ND-MN NA 8.8 15.6 75.0 Grand Forks, ND-MN NA 3.7 11.7 29.5 South Dakota 1,810 38.1 73.9 241.6 Rapid City, SD 320 2.6 9.6 41.7 Sioux Falls, SD 740 12.6 11.7 90.3