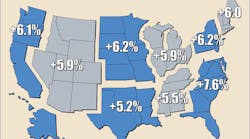
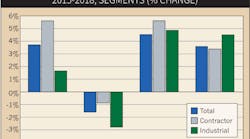
You can use the employment data shown in the charts below to estimate sales potential for this region at the state and MSA (Metropolitan Statistical Area) level with Electrical Wholesaling's Sales-Per Employee Multipliers. Go to the 2020 Market Planning Guide for information on how to use them.
To display your metro, state or region of interest, go to the pull-down menu below at the right and select your region of interest. If you are not sure which region your state is in, check out this list:
New England: Connecticut, Maine, Massachusetts, New Hampshire and Vermont; Middle Atlantic: New Jersey, New York and Pennsylvania; South Atlantic: Delaware, District of Columbia, Florida, Georgia, Maryland, North Carolina, South Carolina, Virginia and West Virginia;
East North Central: Illinois, Indiana, Michigan, Ohio and Wisconsin; East South Central: Alabama, Kentucky, Mississippi and Tennessee; West North Central: Iowa, Kansas, Missouri, Minnesota, Nebraska, North Dakota and South Dakota and West South Central:
Mountain: Arizona, Colorado, Idaho, Montana, Nevada, New Mexico, Utah and Wyoming;
Pacific: Alaska, California, Hawaii, Oregon and Washington Arkansas, Louisiana, Oklahoma and Texas.


