Customer Mix
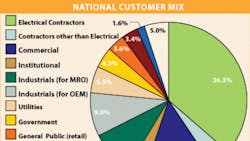
The proportion of electrical distributors' sales that goes to specific customer groups is reported in the “Customer Mix” table. Use the customer mix percentages to estimate the dollar volume of sales that distributors in your area are getting out of each customer market.
At the national level, with 36.3 percent of electrical distributors' sales, electrical contractors are the single largest customer group for electrical distributors.
Note that the percentages assigned to individual regional markets should be used with some caution because of the survey's response rates. The national data is based upon 292 responses to a 2008 survey. The New England, West North Central, East South Central and Mountain regions are based on less than 20 responses, and are subject to a wider margin of error.
Some differences in the business mix exist by region. For instance, the percentage of industrial business in the Midwest is higher than the regions on the coasts because of its concentration of auto and auto-related industries and other types of factories.
(please hover mouse over image for larger view, click on image to open in a new window)