Latest from Market Planning Guide
Employment Data at the MSA & State Level
Sponsored
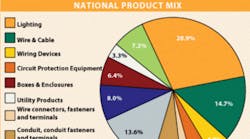
The product mix shows how electrical distributors' sales break down by product group. To use these numbers, multiply your sales figure by each product mix percent to estimate the sales of each type of product. (It's a very rough measure, and the process works better for some types of products than others.) Compare these figures to your own sales by product type to see how your company is doing. By stacking your company's mix up against the ones we give, you can see whether you're in line with other distributors. You can also glimpse where opportunities lurk for specialization and other interesting market insights.
The pie chart on page 35 shows the 10 product groups that command the most mind share with full-line distributors. Not surprisingly, lighting is the largest product group and accounts for 28.9 percent of the sales of all electrical products (22.6 percent if you don't count in residential lighting fixtures, which may or may not be an area of interest). Wire and cable (14.7 percent) is the second-largest product category. Those are interesting numbers to consider because they reflect the investment distributors make in inventory and sales time in these products. This pie chart also shows how hard it can be for small manufacturers of specialty products to gain mind share with distributors when they will naturally focus more of their attention on the products that provide a higher percentage of their sales.
The low percentage (1.1 percent) in the voice/data/video (VDV) market continues to surprise EW's editors. Even if you include security and safety products (one percent), two percent is still a surprisingly low percentage for a product group that's generally considered to be growing at a faster rate than most other traditional electrical product categories. One reason for this low percentage may be that survey respondents counted VDV cabling in the wire and cable category, VDV wall jacks in the wiring device or receptacle categories, and VDV distribution panels as a type of distribution equipment. If you are interested in sales of VDV products, you may get a better feel for the size of this market by looking at some of the full-line distributors with well-established businesses in this segment. It's not unusual for VDV business to account for 10 percent of annual sales for these companies.
Electrical Wholesaling's editors get many questions about the Product Mix from readers searching for more detailed product sales forecasts. The magazine does not have more detailed information available because the product categories as listed here are the same as those used on the survey forms sent to distributor respondents to compile this data. Distributors who want to compare their own product mix percentages with other companies may want to work out a mutual data exchange with noncompeting distributors who would be willing to break down their sales by these product categories.
(please hover mouse over image for larger view, click on image to open in a new window)

