HOW TO USE THE DATA IN THE MARKET PLANNING GUIDE
The late Andrea Herbert, former chief editor of Electrical Wholesaling, launched the Market Planning Guide more than 40 years. She won several national editorial awards for her efforts with the Market Planning Guide, including the Jesse H. Neal Award, the business press’ highest honor.
She wanted the Market Planning Guide to be a practical tool for salespeople and managers at distributors, manufacturers and independent manufacturers’ reps, and her thoughts on how to use it still ring true today:
• Determine market share & penetration.
• Evaluate branch performance and decide which local market areas may support new branches.
• Determine the areas with the greatest sales potential so you can concentrate your salespeople’s efforts in the most productive directions.
• Keep on top of changes in the market area (new residential development, large construction projects in the pipeline & population shifts).
• Direct advertising and promotion to the places where it will have the most impact.
• Explain to suppliers what they can expect from you in the way of market coverage.
• Verify or challenge what suppliers expect from you in sales.
• Set sales quotas for salespeople, territories or product lines.
• Calculate the number of salespeople needed to cover an area.
• Compare how well salespeople in different territories are doing with the same product on the basis of market potential.
• Back up intuition.
WHERE TO FIND THE 2025 DATA AT WWW.EWWEB.COM
All of the 2025 Market Planning Guide data can be found by clicking on “2025 Market Planning Guide” in the menu running in the green bar at the top of the home page. Here are the links to the Market Planning Guide's main article, regional sales data and other tools for market planning:
2025 Market Planning Guide national forecast & analysis of key electrical market trends
New England Region: Connecticut, Maine, Massachusetts, New Hampshire & Vermont
Middle Atlantic Region: New Jersey, New York and Pennsylvania
South Atlantic Region: Delaware, District of Columbia, Florida, Georgia, Maryland, North Carolina, South Carolina, Virginia and West Virginia
East North Central Region: Illinois, Indiana, Michigan, Ohio and Wisconsin
West North Central Region: Iowa, Kansas, Minnesota, Missouri, Nebraska, South Dakota and North Dakota
East South Central Region: Alabama, Kentucky, Mississippi & Tennessee
West South Central Region: Arkansas, Louisiana, Oklahoma & Texas
Mountain Region: Arizona, Colorado, Idaho, Montana, New Mexico, Nevada & Wyoming
Pacific Region: Alaska, California, Hawaii, Oregon & Washington
OTHER REALLY USEFUL DATA
In addition to breaking out our national and regional sales potential estimates, the 2025 Market Planning Guide also offers some other great local data that will help offer a clearer picture of the electrical opportunities available: electrical contractor and industrial employment, population growth, construction projects worth at least $100 million in total construction value and building permits.
Employment Data
You can use use this employment data with EW's sales-per-employee estimates for electrical contractors of $78,775 per employee and industrial customers of $2,650 per employee to develop sales potential estimates at the local and state level.
Population Change (2022-2023 and 2020-2023)
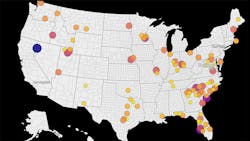
Following population trends is a quick-and-easy way of gauging a market’s local economy. If a market is gaining or losing residents, it obviously affects the tax base, enrollments counts and schools and the need for additional construction for service industries. In our presentation of the U.S. Census Dept.’s 2023 data at the MSA and state level, we map out new-residents-by-day data, which is calculated with the number of folks moving into or out of a local market. It’s a simple calculation that highlights population growth in a fun and easy-to-view manner.
Construction Projects
Electrical work typically accounts for roughly 10% of total construction value of a project, and the construction projects highlighted here offer a sense of the project mix available in a given state or region. Our construction project data was gathered through Oct. 2024. Electrical Marketing newsletter updates its construction project database each quarter, and those updates can be downloaded in a spreadsheet as part of a $99 subscription. Our decision to only include the projects we find of $100 million of more in total contract value is based totally on the bandwidth of the EW staff; we realize that many smaller projects can be even more profitable than larger jobs.
Building Permits
Available monthly from the U.S. Census Bureau on an MSA, state and national level, building permits are a leading indicator of future residential construction because homebuilders typically don’t invest in a permit until they are serious about breaking ground. Permit data is also an early indicator of future nonresidential construction in a local market, because once residential developments go in, the constructions of stores, light commercial and other projects typically follows.
