We are all aware that the overall economy is slowly recovering from the recent downturn and underperforming past recoveries. The recovery from the recent downturn in the overall economy is in the 2% range in deflated dollars. The recovery in the electrical industry in deflated dollars is 1.2%.
Over the long haul our economy historically has grown about 3.5% annually in deflated dollars. Over the last 40 years our industry has grown 1.9% annually in deflated dollars. So growth in the overall economy in the short term and the long term was about twice as fast as the electrical industry.
But it’s not a fair comparison to line up GDP with electrical industry sales. There are big chunks of activity in GDP that are not remotely related to electrical industry performance. A better and more useful comparison is to look at how the electrical industry recovered from the previous industry downturn (2002) and the recovery from the most recent downturn (2009).
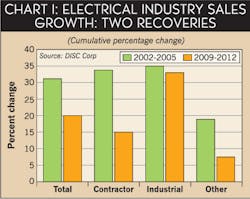
Here we are three years into the recovery and electrical industry sales cumulatively are 20% above the bottom of the 2009 downturn. But three years after the 2002 downturn, industry sales stood a full 30% higher than the low point. What accounts for this difference, which is fairly large, and what is our take-away from this experience?
Market Segments, aka Customer Type
In both recoveries the commonality is that the distributor served industrial market showed the strongest rebound of the four major market segments. Meanwhile, as Chart #1 on this page shows, the growth in the distributor-served contractor market in the earlier downturn outpaced growth in the most recent downturn.
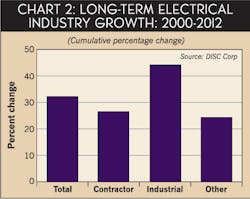
But there is more. In the past 12 years the electrical industry has experienced two downturns. In each, the distributor-served industrial market bounced back faster than the other distributor-served market segments. View that as a short-term phenomenon. Stretching that into a longer term event, between 2000 and 2012, total industry sales grew 32% cumulatively (see Chart #2 on this page). At the same time the distributor-served contractor market grew 26%. But the distributor-served industrial market grew a swift 44%. Historically, in the short term and the long term the distributor-served industrial market has been the most reliable segment for growth in industry sales.
I am not suggesting that will continue, because no two downturns or recoveries are identical, as we will soon see. What I am suggesting here is that the distributor-served industrial market has less volatility, or more stability than the distributor-served contractor market. (Together, these two segments accounted for 80% of total industry sales in 2012).
Economic Drivers
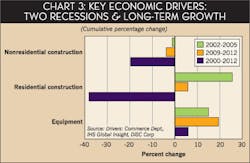
How to explain this? Take a look at the key economic drivers of the electrical industry. In the recovery from the 2002 downturn, investment in business equipment increased nearly 15% between 2002 and 2005. But in the 2009 downturn, investment in business equipment increased 19% cumulatively over the 2009-2012 period.
Finally, residential construction spending increased 26% between 2002 and 2005. In the most recent recovery (2009-2012) residential construction expenditures were up 6%.
To emphasize the point I want to make one more comparison. Take a look at the key indicators between 2000 and 2012 in Chart #3 on this page.
Nonresidential construction spending during that period fell cumulatively by 20%. Residential construction spending fell cumulatively by 38%. But expenditures for business equipment increased more than 6%.
The key takeaway here is that during this 12-year period it was investment in business equipment that was a consistent mainstay of electrical industry growth.
Is this something that is defined as investment in business equipment or is it a nonresidential construction expenditure? I think it depends on the project. And that is a decision made by the Commerce Department.
What I do know is that there is a mixture such that investment in business equipment hits the distributor-served industrial market as well as the distributor-served contractor market. So to the extent that equipment investment is included in the distributor-served contractor market segment it will tend to at least partially offset the volatility in the residential component of the distributor-served contractor market.
Indicators and Industry Growth
Maybe that’s a nice piece of historical analysis, but only some of it will ring true in the current recovery as we go forward over the next five years. Here’s why.
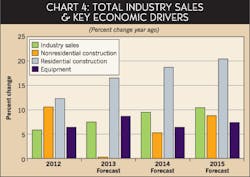
Beginning in 2012 through 2015 residential construction spending is expected to increase more than 65% cumulatively. This is a huge number. At the same time, nonresidential construction spending is expected to increase about 15%. Spending on equipment is projected to increase nearly 25%.
With a 30% cumulative gain in industry sales projected over the 2012-2015 period, and given that the projected indicators are on target, we can be confident that the remainder of this recovery through 2015 will be driven by the residential market.
The residential construction market is coming on very strong in the next few years and that will have a relatively large impact on growth in total electrical industry sales. The expected strength in the residential market is a direct result of the residential bubble that contributed to the Great Recession in the first place.
In 2012 our final numbers show industry growth was up 5.7%, led by an 8% gain in the contractor market and a nearly 4.5% gain in the distributor-served industrial market.
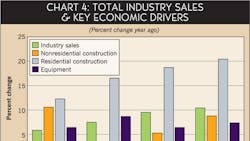
How does that happen when we have been harping on the strength in the industrial market? Sometimes, but not often, expenditures for nonresidential and residential construction grow in concert. This past year both construction indicators grew at a double-digit rate. The equipment indicator grew less than 6.5% in 2012.
Our total distributor sales forecast of 7.5% growth could be a bit optimistic but that is our best point forecast for this year. We will take another look in July to track how the economy is behaving and the resulting impact on industry sales. The key driver for this kind of growth is residential construction spending, up more than 16.5%.
Over the next few years we are looking for distributor sales to advance at a high single-digit rate in 2014 and a low double digit growth rate in 2015. Much of the growth is driven by a strong residential market. We are not ignoring the impact of the energy markets, but the housing market is across the national spectrum while the energy market is more regionalized.
As a wrap up, we are looking for solid gains in industry sales through 2016, with a low single-digit increase in 2017. We’ll continue to track industry sales and keep you posted.
Since founding DISC Corp. almost 30 years ago, Herm Isenstein has become the premier economist in the electrical wholesaling industry. His background, including more than 10 years with General Electric in market planning and analysis assignments and before that as an economic advisor in the oil market, give him a unique perspective. His educational background is in economics and econometrics and he holds an MBA from the University of Chicago. You can contact Herm at 203-799-3673, [email protected].
About the Author
Herm Isenstein
Herm passed away in Sept. 2019 at the age of 86 from brain cancer. He was a good friend to the editors on the staff of Electrical Wholesaling and a prolific writer for the magazine for 15 years.
During his 30-plus years in the electrical industry, Herm Isenstein was the premier economist in the electrical wholesaling industry If you have any questions about DISC's subscription-based data services, contact Chris Sokoll, DISC's president at at 346-339-7528.
